20 години печелим заедно
Moving averages
Moving averages are one of the oldest and most popular technical analysis tools. A moving average is the average price of a financial instrument over a given time. When calculating a moving average, you specify the time span to calculate the average price. For example, it could be 25 days.

A "simple" moving average is calculated by adding the instrument prices for the most recent "n" time periods and then dividing by "n". For instance, adding the closing prices of an instrument for most recent 25 days and then dividing by 25. The result is the average price of the instrument over the last 25 days. This calculation is done for each period in the chart.
Note that a moving average cannot be calculated until you have "n" time periods of data. For example, you cannot display a 25-day moving average until the 25th day in a chart.
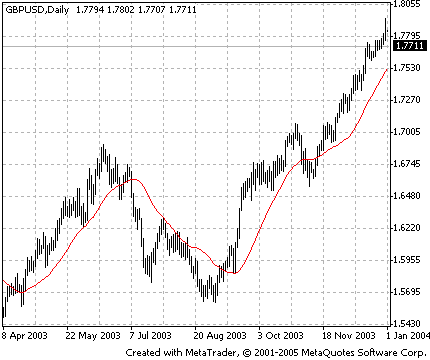
The moving average represents the consensus of investor’s expectations over the indicated period of time. If the instrument price is above its moving average, it means that investor’s current expectations (i.e., the current price) are higher than their average ones over the last 25 days, and that investors are becoming increasingly bullish on the instrument. Conversely, if today’s price is below its moving average, it shows that current expectations are below the average ones over the last 25 days.
The classic interpretation of a moving average is to use it in observing changes in prices. Investors typically buy when the price of an instrument rises above its moving average and sell when the it falls below its moving average.
Advantages
The advantage of moving average system of this type(i.e., buying and selling when prices break through their moving average) is that you will always be on the "right" side of the market: prices cannot rise very much without the price rising above its average price. The disadvantage is that you will always buy and sell some late. If the trend does not last for a significant period of time, typically twice the length of the moving average, you will lose your money.
Moving averages often demonstrate traders’ remorse. Thus, it is very common for an instrument to break through its long-term moving average, and then return to its average before continuing on its way.
Warning: All rights on these materials are reserved by Bulbrokers. Copying or reprinting of these materials in whole or in part is prohibited.